The Nifty over in 2013 did something expected - it did three peak- two troughs ~ 2.5 cycles in one year as shown in the chart below.
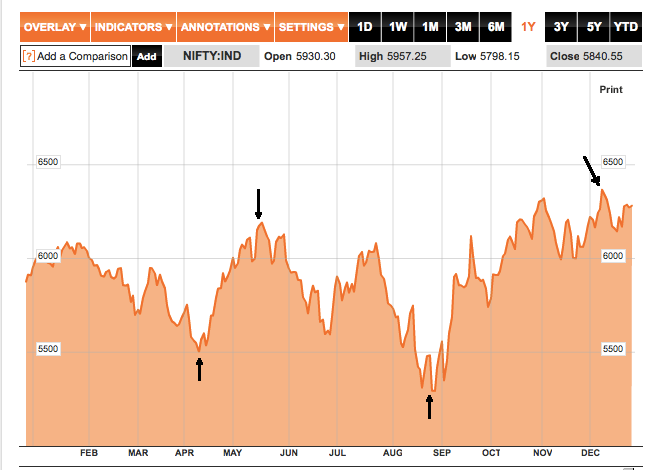 |
| NIFTY over 2013 calendar (Bloomberg.com) |
Firstly, the amplitude of the first cycle is smaller than second cycle. I see this increasing over the next year. Thus, in 2014, Nifty will have at least 2.5 cycles each with amplitude at least as much as the second cycle of 2013. It means a lot of volatility which is positive or negative depending on how you look at it.
Secondly, the time between the two cycles is quite small and there was a muted volatility (bearish lull between End Jan to Mid April and bullish lull between end oct to Dec). I see this muted periods getting compressed. In effect we may have crudely speaking one more cycle in 2014.
Thirdly, if you see the underlying macro/micro data it has generally worsened over this period though we are near to all time highs. It is quite parallel to US equity markets.
Buy my books "Subverting Capitalism & Democracy" and "Understanding Firms".
No comments:
Post a Comment
Note: only a member of this blog may post a comment.